Kentaro Takahira
School of Informatics, Kyoto University, ktakahira@i.kyoto-u.ac.jp

Science Frontier Bldg. 502
Yoshida Campus, Kyoto Univ.
先端科学研究棟502
吉田キャンパス医学部構内
I published a book on data visualization! amazon
データ可視化完全入門(技術評論社)を出版しました。
I’m an Assistant Professor in the Department of Social Informatics, Graduate School of Informatics, Kyoto University. I co-organize Inclusive Design Lab with Naomi Yamashita. I received my Ph.D. in Computer Science and Engineering from the Hong Kong University of Science and Technology (HKUST), where I was advised by Huamin Qu.
My research lies at the intersection of data visualization, virtual and augmented reality (VR/AR), and human-AI interaction. I’m particularly interested in how AR and VR can make the exploration and communication of data more effective. My work has appeared at venues such as CHI, UIST, MM, VIS, and AAAI.
Before my Ph.D., I spent years in Tokyo as a data scientist at a consulting firm and a startup, and taught data analysis and visualization through corporate training and online courses. I also do pro bono work applying ICT to humanitarian causes.
高比良健太郎と申します。京都大学大学院情報学研究科 社会情報学専攻 共生デザイン分野に所属しています。データ可視化を軸に、新しいユーザインタフェースのデザインや、AIとの対話に関する研究に取り組んでいます。香港科技大学(HKUST)にて博士号を取得し、それ以前は、コンサルやスタートアップでデータ解析やモデル構築の業務に従事していました。学部と修士は京都大学で学びました。研究と実務の距離が近い領域であるため、そこで得た知見を実務の現場にも還元していきたいと考えています。書籍の執筆や研修などのご依頼も承っております。
news
| Oct 01, 2026 | I joined Graduate School of Informatics, Kyoto University as an Assistant Professor. |
|---|---|
| Jul 14, 2026 | I successfully defended my PhD thesis. Thank you to HKUST, the VisLab team, and everyone in Hong Kong who supported me throughout this journey. |
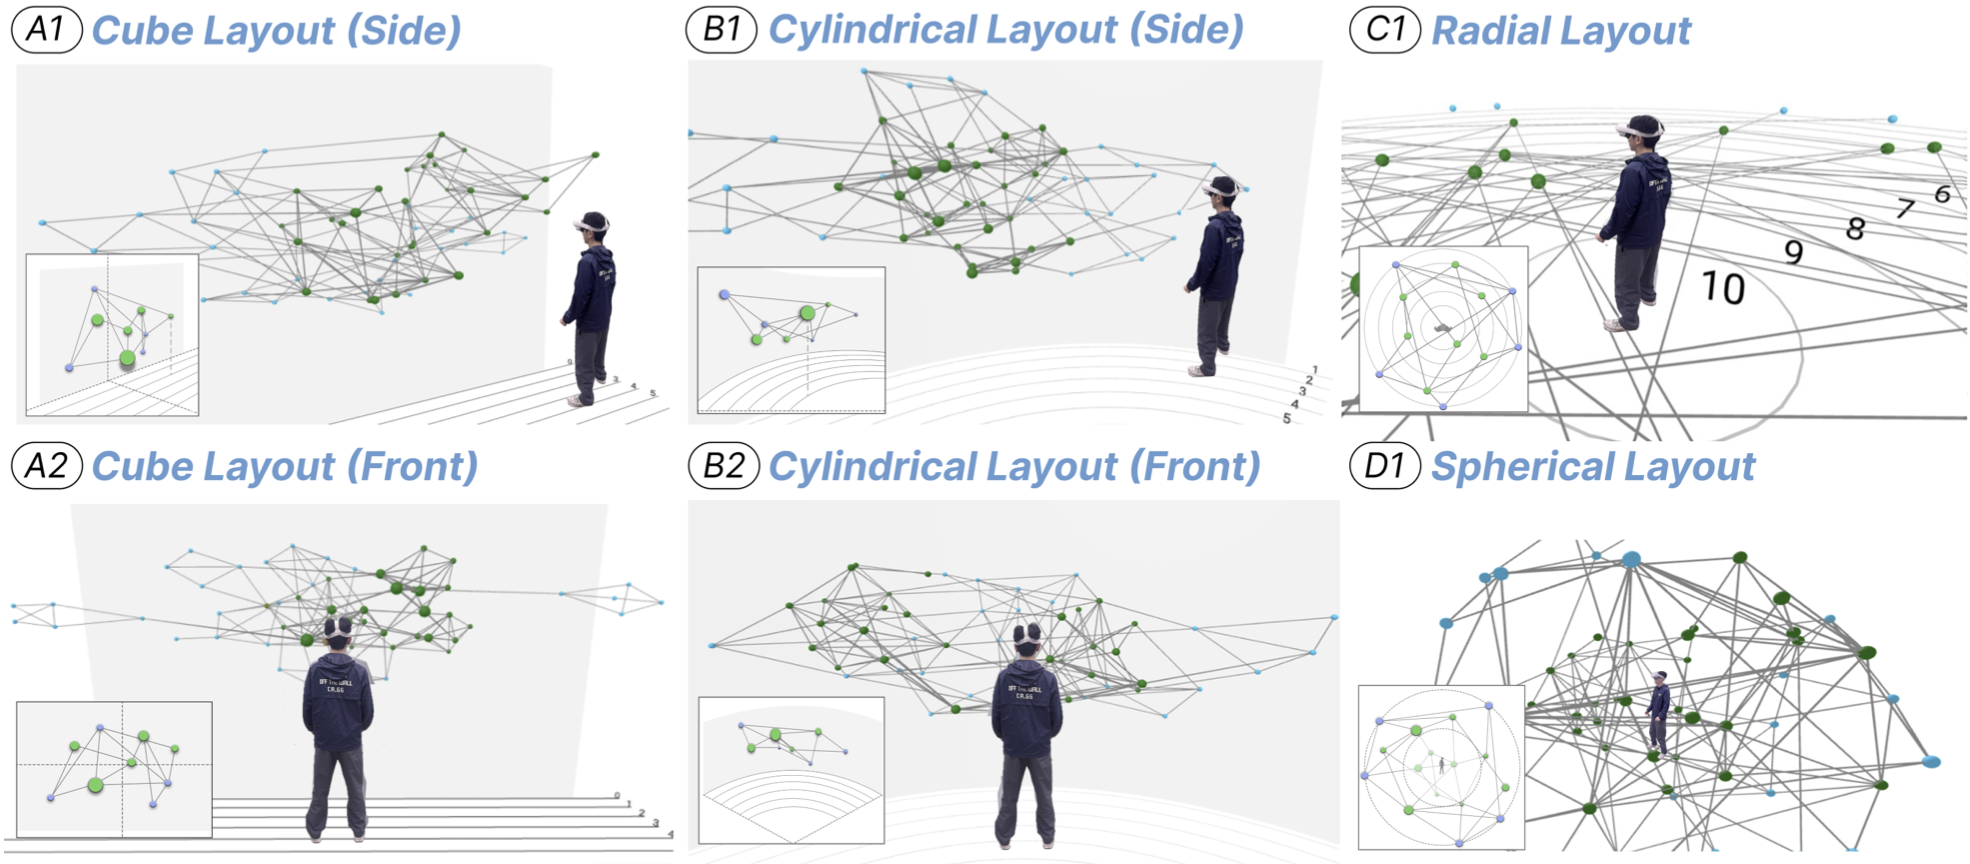
| Jun 29, 2026 | My first-author paper Surrounded by Friends: Design and Evaluation of Immersive Layouts of Egocentric Network for Visual Analytics has been conditionally accepted at ACM SUI 2026. |
| May 16, 2026 | I gave an invited talk at the Disaster Prevention Research Institute (DPRI), Kyoto University. |
| Apr 25, 2026 | I finished my visiting scholar appointment at the HCI Lab, University of Waterloo and returned from Waterloo. |
selected publications
books and courses*

Book: Data Visualization in Practice
技術評論社「データ可視化完全入門」
An introduction to data visualization that explains key principles and techniques for designing effective charts based on real-world business challenges.
データ可視化の「理論」とビジネス課題にもとづいた「実践」をもとに、データ可視化の手法を解説した書籍です。Excel での操作解説も付属します。
Everyone working with data Book Link (Amazon)

Course: Practical Graph Design
Schoo「練習問題で学ぶデータ可視化」
This course teaches how to choose and design effective charts for various types of data and tasks.
様々なデータやタスクごとに、効果的なグラフのデザイン方法を解説した講座です。resources ページで Excel ファイル をダウンロードできます。
Everyone working with data Course Link

Course: Graph Design with Python
Schoo「Pythonを活用したグラフ作成プロセス」
Hands-on course on data visualization using Python libraries, including matplotlib, seaborn and plotly.
matplotlib、seaborn、plotlyなどのPythonライブラリを用いたデータの可視化方法を解説しています。resources ページで notebook をダウンロードできます。
Enginneers interested in data visualization Course Link

Course: Introduction on AI Design System Design
企業研修「AIデザイナー育成講座」
A hands-on course offering a broad overview of AI, designed for management-level business professionals, conducted in collaboration with the SUS in Kyoto.
京都のSUSと共同で実施した、管理職レベルを対象としたAIの包括的な概要を提供する講座です。
Managers without backgrounds of AI Course Link
* Book and Courses are in Japanese.